

Introduction
The First 5 Minutes Aren’t Random, They Reveal Direction
The New York session is one of the most volatile and liquid periods in the trading day, especially for NASDAQ and US indices.
Sharp moves, fake breakouts, and sudden reversals can make it difficult for retail traders to find consistency.
That’s where the 5-Minute Opening Candle Framework comes in.
This setup uses the first 5-minute candle of the NY open (9:30 AM NY / 2:30 PM UK) to frame structure and direction, then combines 1-minute Fair Value Gaps (FVGs) and engulfing confirmations for surgical entries.
It’s a clean, rule-based intraday method designed for traders who want precision, not prediction.
Why the 5-Minute Candle Matters
The first 5-minute candle after the New York open often sets the tone for the rest of the session.
It defines the initial range, builds liquidity pools, and reveals where Smart Money might engineer the first move of the day.
By marking this candle, traders can see:
- The session’s early imbalance (who’s in control)
- Potential liquidity targets above and below the range
The likely continuation or reversal zones once displacement occurs
This framework ensures you trade with session context, not emotion.
Step-by-Step: How to Trade the NASDAQ NY Session Strategy
Step 1
Mark the 5-Minute Opening Candle
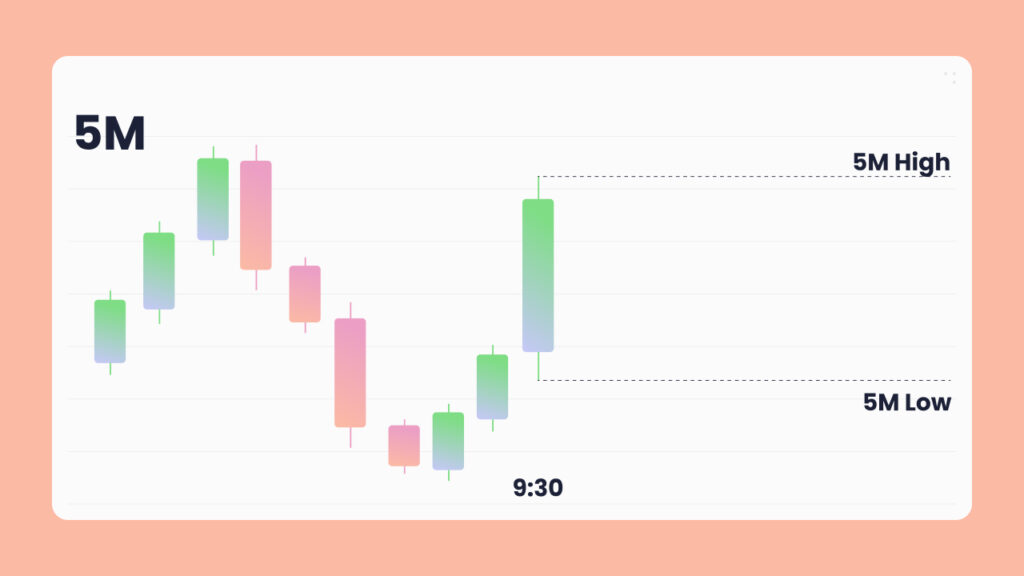
At 9:30 AM (New York time), mark the high and low of the first 5-minute candle.
This defines your initial range and creates two key liquidity zones:
- Buy-side liquidity above the high
- Sell-side liquidity below the low
This zone becomes your reference point for all trades during the session.
Step 2
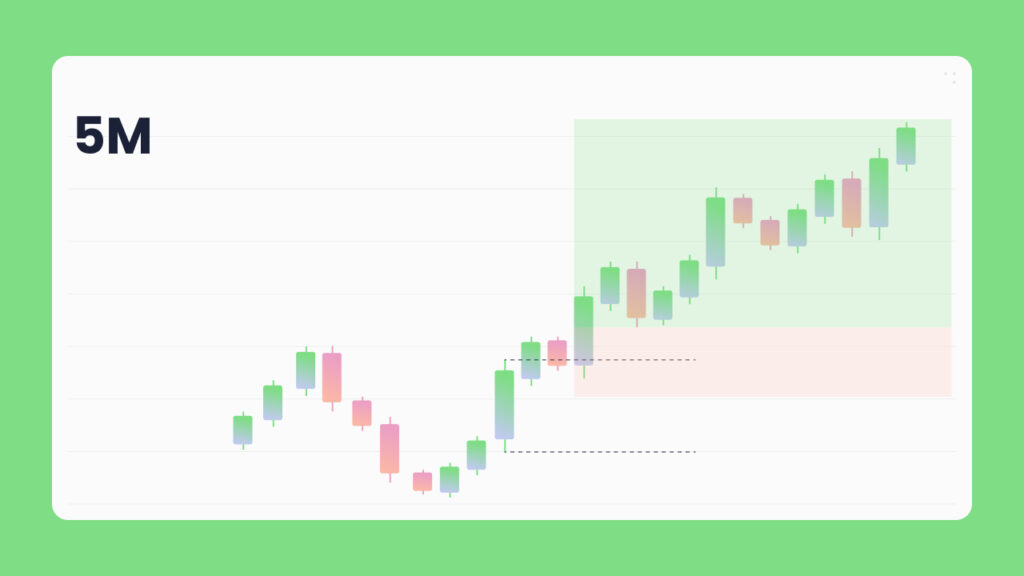
Wait for Breakout on the 1-Minute Chart
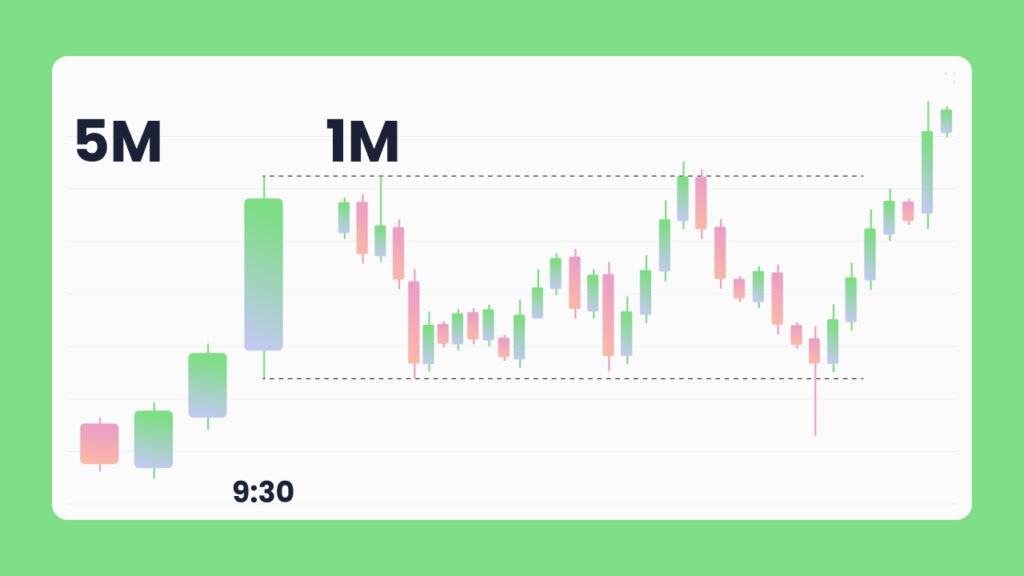
Once the range is marked, drop down to the 1-minute chart.
Watch for displacement, a strong breakout above or below the 5-minute range.
⚠️ Don’t enter yet. Breakouts often trap retail traders.
Your goal is to identify where Smart Money displaces price, not to chase it.
Step 3
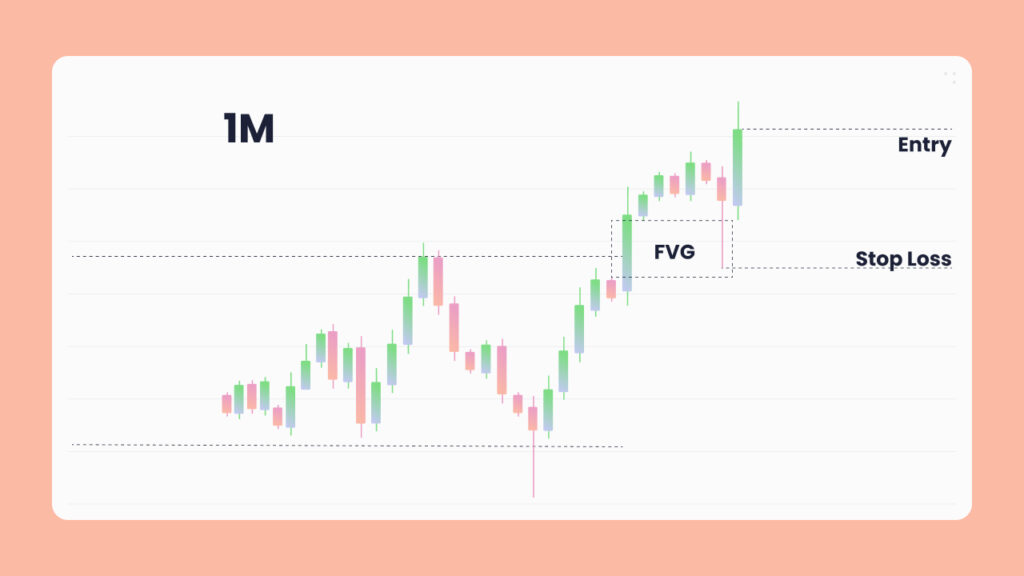
Identify the 1-Minute Fair Value Gap (FVG)
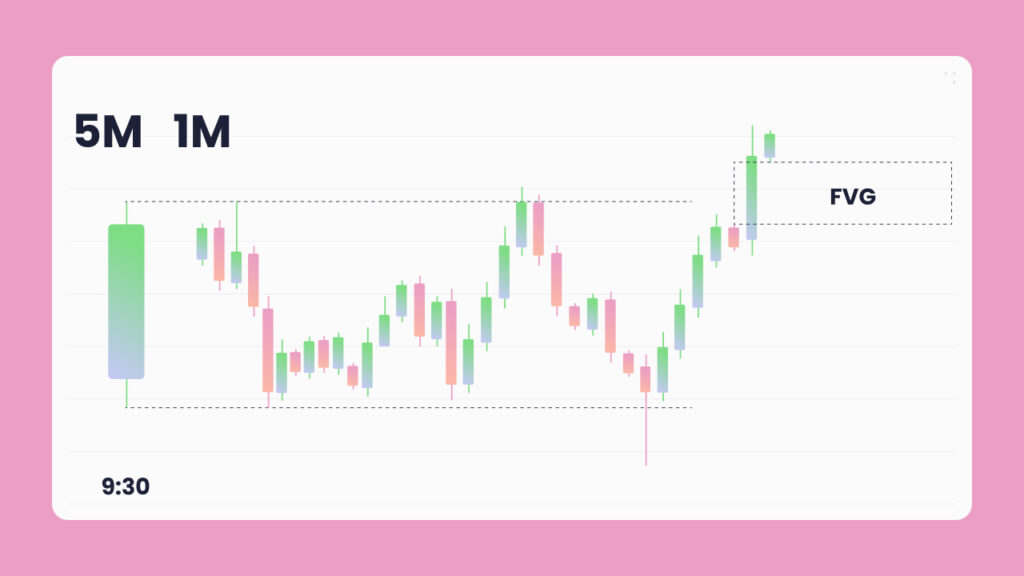
After displacement, locate the 1-minute FVG created during the breakout move.
This is your value zone, the area price is likely to revisit before continuing.
- If price broke above the 5m high → look for a bullish FVG below.
- If price broke below the 5m low → look for a bearish FVG above.
Mark this zone clearly. It’s where the next entry opportunity will form
Step 4
Wait for Retest of the FVG
Patience pays here.
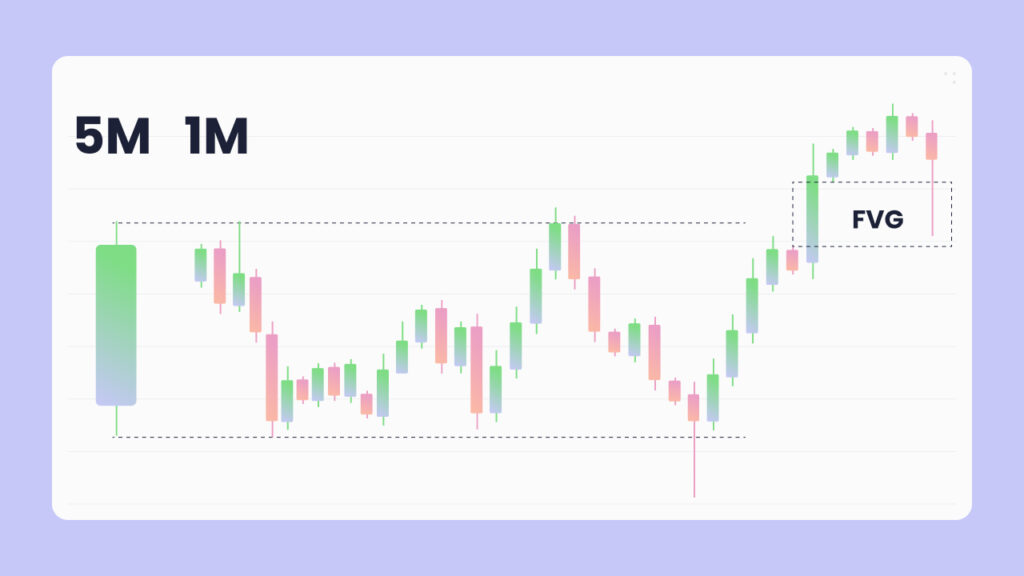
Allow price to retrace back into the FVG, this is where Smart Money re-enters after taking liquidity and confirming direction.
Avoid entering on impulse; wait for your confirmation trigger.
Step 5
Enter on Engulfing Confirmation
Once price taps the FVG, watch closely for an engulfing candle that confirms continuation in the direction of the breakout.
This candle shows that buyers or sellers are reclaiming control after the retest.
- For longs → wait for a bullish engulfing candle.
- For shorts → wait for a bearish engulfing candle.
Your entry is taken at or near the engulfing candle close, targeting the next liquidity pool or a fixed risk/reward ratio.
Step 6
Manage Risk and Targets
Set your stop loss just below (for buys) or above (for sells):
- The 5-minute candle open, or
- The recent 1-minute swing high/low
This keeps risk tight while maintaining session structure integrity.
Your take-profit can be managed in two ways:
- Fixed Target: 1:3 RR minimum (roughly 3%)
- Dynamic Target: Next liquidity pool (previous high/low or imbalance fill)
This ensures you’re trading with precision and discipline, not emotion.
Example
Let’s say NASDAQ opens strong and the first 5-minute candle forms a tight range.
Price breaks above the range on a surge of volume.
You switch to the 1-minute chart and spot a clean bullish FVG left behind.
Price retraces, taps into that FVG, and forms a bullish engulfing candle.
You enter long at the candle close, stop below the FVG, and target the next liquidity high.
A few minutes later, price runs the next pool, your trade hits 3R, clean and controlled.
Why This Strategy Works
This setup combines:
- Session timing (NY open = high volatility)
- Structure (5m range defines liquidity)
- Smart Money concepts (FVGs and displacement)
- Confirmation (engulfing candles validate intent)
It gives traders a mechanical edge within one of the most aggressive trading windows of the day.
Trading Style
Best For: Intraday Traders
Works On: NASDAQ • Forex (NY Session)
Confluences: Fair Value Gaps (FVGs), Break of Structure (BOS), Engulfing Candles, Session Timing
Key Takeaways
✅ Use the 5m opening candle to frame session structure
✅ Wait for breakout and identify the 1m FVG
✅ Enter on the FVG retest with engulfing confirmation
✅ Keep stops tight and target 1:3 RR or liquidity zones
Final Thoughts
The NASDAQ 5-Minute Opening Candle Strategy brings clarity to the chaos of the New York session.
Instead of reacting to volatility, you’re anticipating where value lies, and trading with precision around it.
Remember:
“Smart traders don’t chase breakouts. They wait for price to return to value, and confirm intent.” Master this framework, and you’ll transform how you trade the NY open forever.
Overview
The First 5 Minutes Aren’t Random, They Reveal Direction
The NASDAQ 5-Minute Opening Candle Strategy captures the structured volatility of the New York open (9:30 AM NY / 2:30 PM UK).
By marking the range of the first 5-minute candle and using it as a directional framework, traders can isolate premium setups built around displacement, FVGs, and confirmation on the lower timeframe.
It’s a clean, mechanical model, one setup, same window, every day.
The Core Framework
1. Mark the First 5-Minute Candle Range
At 9:30 AM NY, mark the high and low of the first 5-minute candle.
This defines your opening range, the liquidity boundary.
2. Wait for Breakout
- After the 5-minute range forms, price will break either above or below.
- Drop to the 1-minute chart to track displacement.
3. Confirm with FVG
A strong move with a Fair Value Gap (FVG) confirms institutional participation.
4. Execute on Retrace
When price returns to the FVG, enter in the direction of the breakout.
Stops go below/above the breakout candle; target 1:3 RR or opposing liquidity.
Execution Tips
✅ Only trade this during the NY open — that’s when volume peaks.
✅ Avoid fake breakouts; wait for displacement confirmation.
✅ Combine with higher-timeframe bias for directional clarity.
Summary
- Mark 5m range.
- Wait for breakout.
- Confirm with 1m FVG.
- Enter on retrace; target liquidity.
Simple, repeatable, and highly mechanical.
Institutional Context
The 5-Minute Opening Candle represents institutional liquidity mapping at the New York open.
During this time, Smart Money establishes directional intent, clears stops, and engineers displacement.
The model exploits this volatility by pairing the 5m range with lower-timeframe execution confirmation.
Execution Logic
- Time Window: 9:30–9:35 AM NY defines the range.
- Breakout: Wait for one-sided expansion beyond the range.
- Displacement: Confirm with FVG or BOS on 1m chart.
- Entry: Execute on retrace into the displacement zone.
- Risk: Stop at candle open/swing; partials into 1:3 RR or external liquidity.
Precision Notes
- Only valid during high-volume opens (NASDAQ/indices).
- Optimal when aligned with daily bias and session liquidity.
- Use SMT divergence or volume imbalance for entry confirmation.
Principle
The 5-minute range defines intent; displacement confirms it. Precision comes from trading the retrace, not the breakout.